Unravelling the Roots: Fishbone Diagram for Root Cause Analysis
Introduction
Root cause analysis (RCA) is a systematic approach to identifying the underlying cause of a problem or issue. One popular RCA tool is the Fishbone Diagram, also known as the Ishikawa Diagram or Cause-and-Effect Diagram. This visual tool is designed to help teams identify, explore, and address the root causes of problems, enabling them to develop effective solutions, we will delve into the Fishbone Diagram, its structure, how to create one, and its benefits in the root cause analysis process.
What is a Fishbone Diagram?
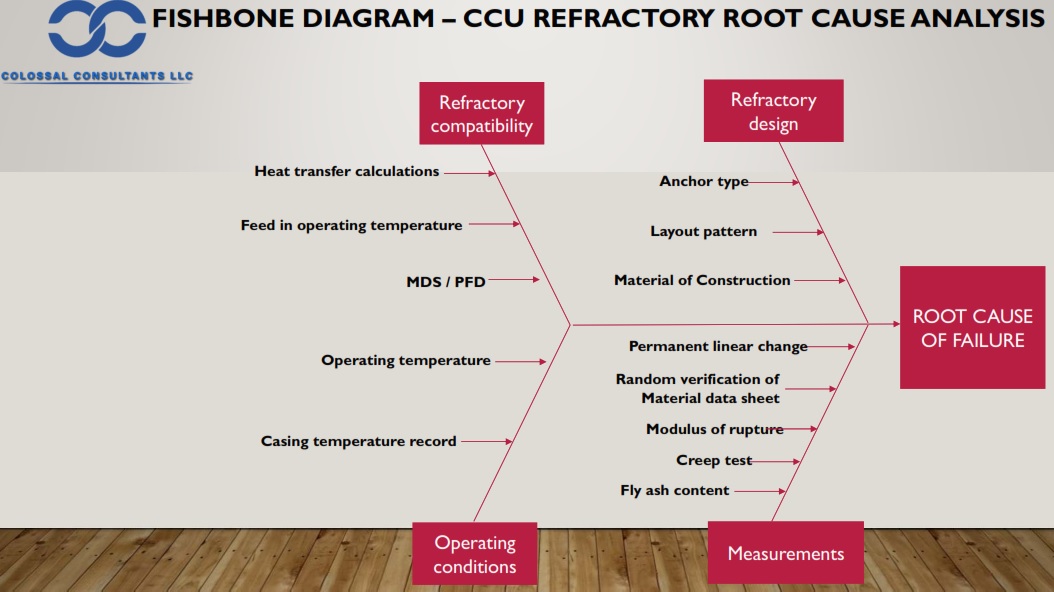
The Fishbone Diagram is named for its shape, resembling a fish's skeleton with a central "spine" and multiple "bones" branching off of it. The diagram's primary purpose is to organize possible causes of a problem into categories, making it easier for teams to systematically brainstorm and analyse potential root causes. The diagram's structure encourages a thorough examination of a problem by considering all possible contributing factors and their relationships.
Structure of the Fishbone Diagram
A typical Fishbone Diagram has four main components:
Problem Statement (Fish Head): The problem or issue being analysed is stated clearly and concisely at the "head" of the fish.
Main Categories (Primary Bones): These branches off the central spine represent the main categories of potential causes. The number of categories may vary, but a common approach is to use the 6Ms (Man, Machine, Method, Material, Measurement, and Mother Nature) as a starting point.
Sub-Categories (Secondary Bones): These branches further divide the main categories into more specific factors that could contribute to the problem.
Causes (Tertiary Bones): Finally, these branches identify the possible root causes within the sub-categories.
Creating a Fishbone Diagram
Follow these steps to create an effective Fishbone Diagram for your root cause analysis:
- Define the Problem: Clearly state the problem or issue you want to analyse. This statement should be specific and concise, as it will serve as the starting point for your diagram.
- Draw the Central Spine: Create a horizontal line (the central spine) and place the problem statement in a box at the right end of the line (the fish head).
- Identify Main Categories: Brainstorm the main categories of potential causes for the problem. You can use the 6Ms as a starting point or adapt the categories to your specific situation.
- Add Sub-Categories and Causes: Identify sub-categories and specific causes for each main category. Keep drilling down until you have identified all possible root causes.
- Analyse and Prioritize: Review the diagram and identify the most likely root causes of the problem. Prioritize these causes based on their impact and feasibility for resolution.
Benefits of Using a Fishbone Diagram in Root Cause Analysis
- Comprehensive Analysis: The Fishbone Diagram encourages a thorough examination of a problem by considering all possible contributing factors and their relationships.
- Encourages Collaboration: The visual nature of the Fishbone Diagram makes it an excellent tool for fostering teamwork and collaboration, as it allows everyone to see and understand the relationships between potential causes.
- Easy to Understand: The diagram is visually appealing and easy to interpret, making it accessible to team members with various levels of expertise.
- Identifies Areas for Improvement: By analysing the various causes, teams can identify areas where improvements can be made, leading to more effective solutions.
- Enables Effective Problem Solving: By identifying the root causes of a problem, teams can develop targeted solutions that address the underlying issues, rather than merely treating the symptoms.
Conclusion
The Fishbone Diagram is a powerful tool for conducting root cause analysis, providing a structured and visual approach to identifying the underlying causes of a problem. By categorizing potential causes and encouraging a comprehensive analysis, this diagram helps teams collaborate more effectively, identify areas for improvement, and develop targeted solutions. By implementing the Fishbone Diagram in your root cause analysis process, you'll be better equipped to address complex problems and drive continuous improvement within your organization.